Tools
The tools developed within the SPEARHEAD project are presented here. They are shared open access via the official SPEARHEAD repository on GitHub and the SPEARHEAD Jupyterhub where available.
You can find a user guide for the SPEARHEAD Jupyterhub here.
bowtie: Bow-tie analysis for the energy channels of a generic particle instrument
This analysis tool runs a bow-tie analysis (Van Allen et al. 1974) for the energy channels of a generic particle instrument. The input is a csv table of channel responses indexed by the incident energy. The results of analysis are the geometric factor (with errors) and the effective energy of the channel.

FDAT: Forbush Decrease Analysis Tool
A graphical interface tool for analyzing Forbush decrease and Interplanetary Coronal Mass Ejection (ICME) events, conducting ForbMod best-fit calculations on selected data regions and performing in-situ analysis of ICMEs.
FDAT enables to:
- Plot and analyze ICME/Forbush decrease events
- Select borders of ICME events and related Forbush decreases
- Perform in-situ analysis of ICMEs
- Execute ForbMod best-fit procedures on selected events
- Generate comprehensive analysis outputs and visualizations

G4VM: GEANT4 Virtual Machine for simulations of SOHO/Chandra EPHIN and Solar Orbiter HET
The G4VM (GEANT4 Virtual Machine) aims to make GEANT4 instrument simulations of SOHO/Chandra EPHIN and Solar Orbiter HET readily accessible.
It contains the corresponding GDML models along with a compatible GEANT4 application. The models incorporate the sensitive detectors of the instruments and the passive material shielding the detectors, represented with high precision. Each instrument is provided individually and with a spacecraft model that maps the spacecraft’s shielding material onto spherical shell segments with varying densities to account for directionality.
The GEANT4 application can be built independently but is provided in a configuration that works seamlessly within the recommended setup.

VDA: Velocity Dispersion Analysis of Solar Energetic Particle events
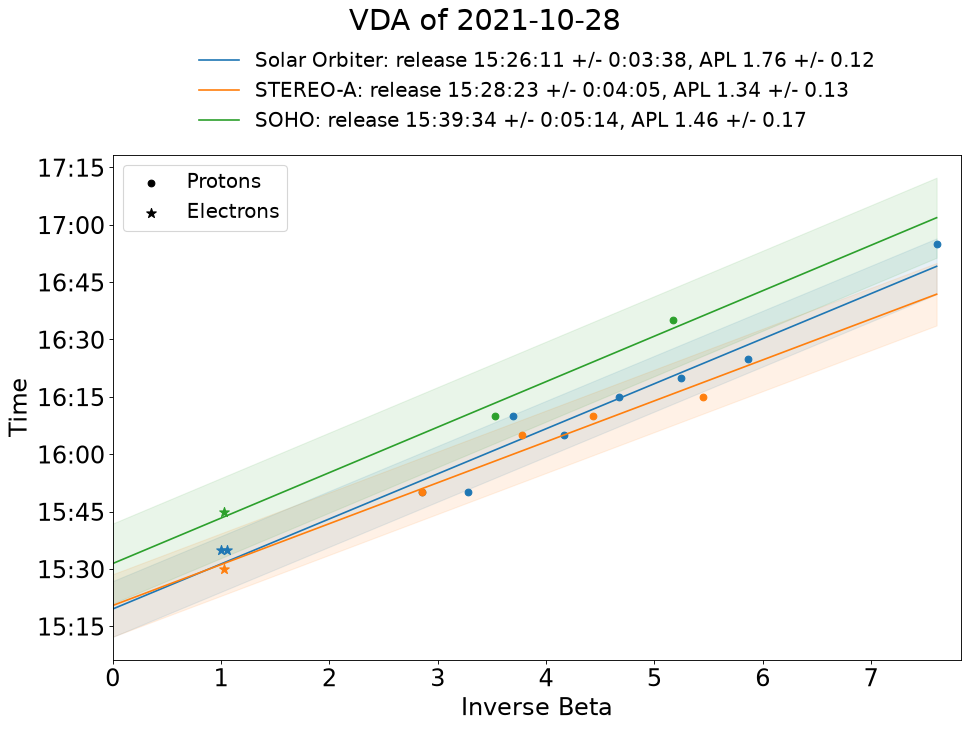
The SPEARHEAD VDA tool supports the semi-automatic Velocity Dispersion Analysis (VDA) of Solar Energetic Particle (SEP) events observed by Solar Orbiter, STEREO-A, Parker Solar Probe, SOHO, Wind and BepiColombo. VDA uses the onset times of the particles at different energies to estimate their release time at the Sun and their apparent path length (APL). It assumes that particles of all energies are released at the same time and travel the same path (see Kolympiris et al. 2023, Lintunen & Vainio 2004). For each event, the tool gives the release time at the Sun, the times its light reaches 1 AU and the spacecraft, and the APL in AU, with a plot of the VDA fit and a table of the results. Reference times, such as the soft X-ray peak or a radio burst, can be shown in the plot for comparison.
The tool has three Jupyter notebooks: one for one or more events from one spacecraft, one for one event from several spacecraft with their VDA fits in one plot, and one for onset times given by the user. The events are given as datetime ranges or reference times, from a file or in a form. The same form selects the particle species, sensors, viewing directions and background windows. The analysis can also be run from Python scripts.
SEP-PACT (Solar Energetic Particle Analysis and Calculation Tool)
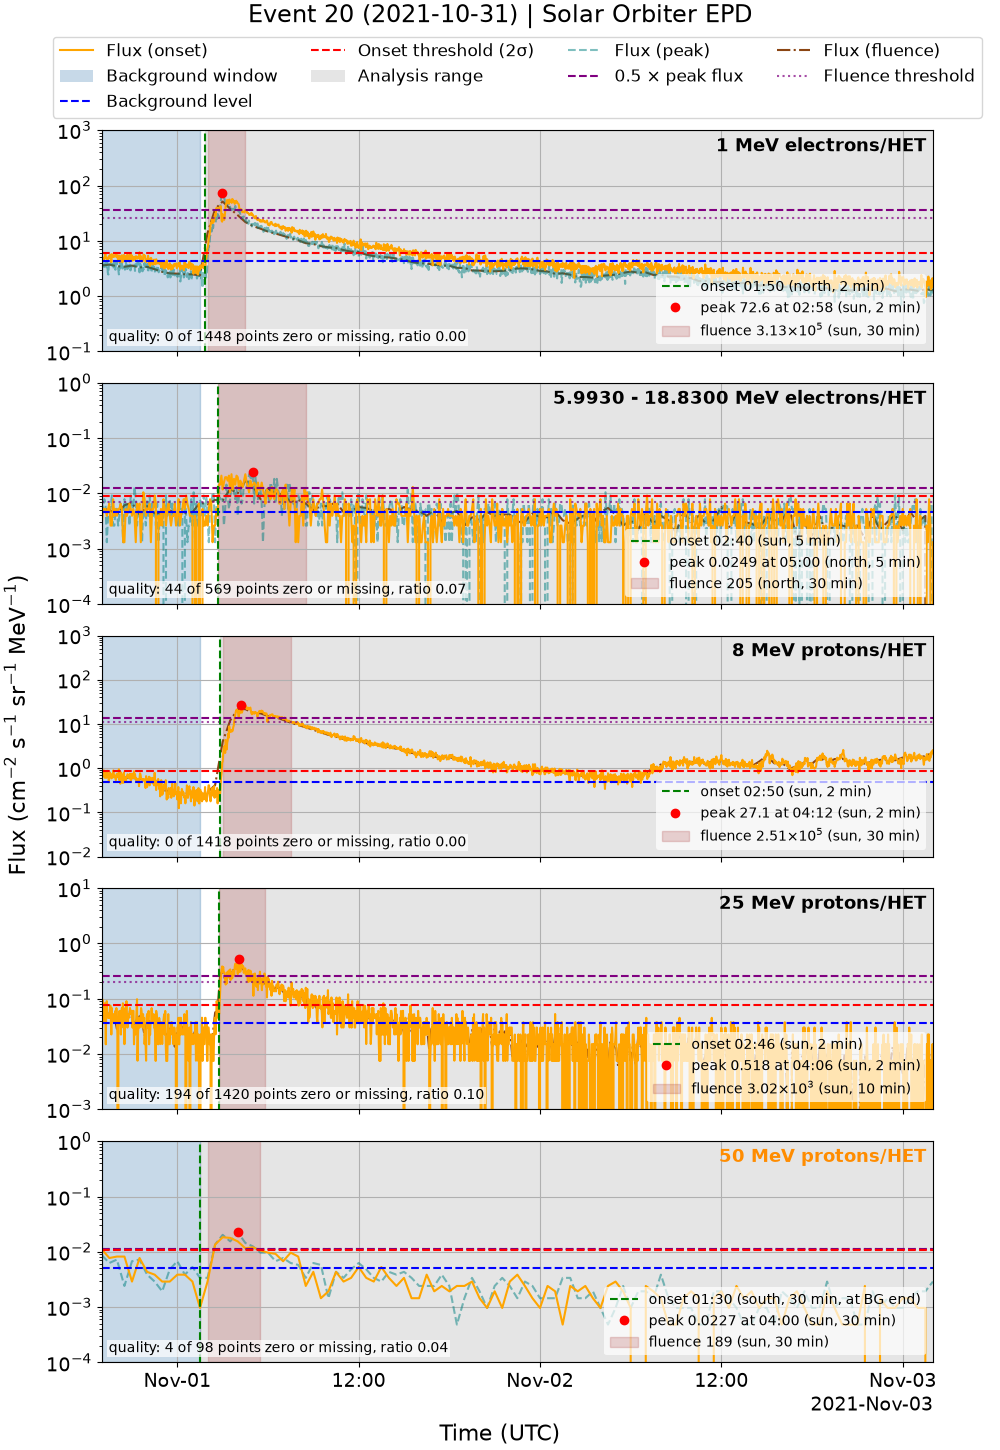
SEP-PACT (Solar Energetic Particle Analysis and Calculation Tool) analyses Solar Energetic Particle (SEP) events automatically, with the data of the High Energy Telescope (HET) of Solar Orbiter’s Energetic Particle Detector (EPD). For every event and energy channel group, it computes the onset time, the peak flux and its time, and the fluence of electrons and protons.
Each quantity is calculated at several time resolutions and in the four viewing directions of HET (sun, asun, north, south), and the tool chooses one result per channel group. The interplanetary shocks during the events are taken from the SODA shock list, or from a shock list of your own. A Jupyter notebook takes you through the analysis: a form with all the parameters, the background window and end time of each event, and an event viewer to check the plot and results of each event and correct its onsets. The results are saved as a CSV table and one plot per event.